Showing posts with label Geophysics. Show all posts

Bases and Base Networks

Bases and Base Networks
Bases (base stations) are important in gravity and magnetic surveys, and in
some electrical and radiometric work. They may be:
1. Drift bases – Repeat stations that mark the starts and ends of sequences
of readings and are used to control drift.
2. Reference bases – Points where the value of the field being measured has
already been established.
3. Diurnal bases – Points where regular measurements of background are
made whilst field readings are taken elsewhere.
A single base may fulfil more than one of these functions. The reliability
of a survey, and the ease with which later work can be tied to it, will often
depend on the quality of the base stations. Base-station requirements for
individual geophysical methods are considered in the appropriate chapters,
but procedures common to more than one type of survey are discussed below.
 Base station principles
There is no absolute reason why any of the three types of base should coincide,
but surveys tend to be simpler and fewer errors are made if every drift
base is also a reference base. If, as is usually the case, there are too few
existing reference points for this to be done efficiently, the first step in a
survey should be to establish an adequate base network.
It is not essential that the diurnal base be part of this network and, because
two instruments cannot occupy exactly the same point at the same time, it
may actually be inconvenient for it to be so. However, if a diurnal monitor
has to be used, work will normally be begun each day by setting it up and
end with its removal. It is good practice to read the field instruments at a drift
base at or near the monitor position on these occasions, noting any differences
between the simultaneous readings of the base and field instruments.
 ABAB ties
Bases are normally linked together using ABAB ties (Figure 1.13). A reading
is made at Base A and the instrument is then taken as quickly as possible


to Base B. Repeat readings are then made at A and again at B. The times
between readings should be short so that drift, and sometimes also diurnal
variation, can be assumed linear. The second reading at B may also be the
first in a similar set linking B to a Base C, in a process known as forward
looping.
Each set of four readings provides two estimates of the difference in field
strength between the two bases, and if these do not agree within the limits
of instrument accuracy (±1 nT in Figure 1.13), further ties should be made.
Differences should be calculated in the field so that any necessary extra links
can be added immediately.

 Base networks
Most modern geophysical instruments are accurate and quite easy to read,
so that the error in any ABAB estimate of the difference in value between
two points should be trivial. However, a final value obtained at the end of
an extended series of links could include quite large accumulated errors. The
integrity of a system of bases can be assured if they form part of a network in
which each base is linked to at least two others. Misclosures are calculated by
summing differences around each loop, with due regard to sign, and are then
reduced to zero by making the smallest possible adjustments to individual
differences. The network in Figure 1.14 is sufficiently simple to be adjusted


by inspection. A more complicated network could be adjusted by computer,
using least-squares or other criteria, but this is not generally necessary in
small-scale surveys.
 Selecting base stations
It is important that bases be adequately described and, where possible, permanently
marked, so that extensions or infills can be linked to previous work
by exact re-occupations. Concrete or steel markers can be quickly destroyed,
either deliberately or accidentally, and it is usually better to describe station
locations in terms of existing features that are likely to be permanent. In any
survey area there will be points that are distinctive because of the presence
of manmade or natural features. Written descriptions and sketches are the
best way to preserve information about these points for the future. Good
sketches are usually better than photographs, because they can emphasize
salient points.
Permanence can be a problem, e.g. maintaining gravity bases at international
airports is almost impossible because building work is almost always
under way. Geodetic survey markers are usually secure but may be in isolated
and exposed locations. Statues, memorials and historic or religious buildings
often provide sites that are not only quiet and permanent but also offer some
shelter from sun, wind and rain.

Global Positioning Satellites

Small, reasonably cheap, hand-held GPS receivers have been available since
about 1990. Until May 2000, however, their accuracy was no better than
a few hundred metres in position and even less in elevation, because of
deliberate signal degradation for military reasons (‘selective availability’ or
SA). The instruments were thus useful only for the most regional of surveys.
For more accurate work, differential GPS (DGPS) was required, involving
a base station and recordings, both in the field and at the base, of the estimated
ranges to individual satellites. Transmitted corrections that could be
picked up by the field receiver allowed real-time kinetic positioning (RTKP).
Because of SA, differential methods were essential if GPS positioning was
to replace more traditional methods in most surveys, even though the accuracies
obtainable in differential mode were usually greater than needed for
geophysical purposes.
 Accuracies in hand-held GPS receivers
The removal of SA dramatically reduced the positional error in non-differential
GPS, and signals also became easier to acquire. It is often now possible to
obtain fixes through forest canopy, although buildings or solid rock between
receiver and satellite still present insuperable obstacles. The precision of the
readouts on small hand-held instruments, for both elevations and co-ordinates,
is generally to the nearest metre, or its rough equivalent in latitude and longitude
(0.00001◦). Accuracies are considerably less, because of multi-path
errors (i.e. reflections from topography or buildings providing alternative
paths of different lengths) and because of variations in the properties of the
atmosphere. The main atmospheric effects occur in the ionosphere and depend
on the magnitude and variability of the ionization. They are thus most severe
during periods of high solar activity, and particularly during magnetic storms
(Section 3.2.4).
Because of atmospheric variations, all three co-ordinates displayed on a
hand-held GPS will usually vary over a range of several metres within a
period of a few minutes, and by several tens of metres over longer time
intervals. Despite this, it is now feasible to use a hand-held GPS for surveys
with inter-station separations of 100 m or even less because GPS errors,
even if significant fractions of station spacing, are not, as are so many other
errors, cumulative. Moreover, rapid movement from station to station is, in
effect, a primitive form of DGPS, and if fixes at adjacent stations are taken
within a few minutes of each other, the error in determining the intervening
distance will be of the order of 5 metres or less. (In theory, this will not
work, because corrections for transmission path variations should be made
individually for each individual satellite used, and this cannot be done with
the hand-held instruments currently available. However, if distances and time
intervals between readings are both small, it is likely that the same satellite
constellation will have been used for all estimates and that the atmospheric
changes will also be small.)
 Elevations from hand-held GPS receivers
In some geophysical work, errors of the order of 10 metres may be acceptable
for horizontal co-ordinates but not for elevations, and DGPS is then still
needed. There is a further complication with ‘raw’ GPS elevations, since
these are referenced to an ellipsoid. A national elevation datum is, however,
almost always based on the local position of the geoid via the mean sea level
at some selected port. Differences of several tens of metres between geoid
and ellipsoid are common, and the source of frequent complaints from users
that their instruments never show zero at sea level! In extreme cases, the
difference may exceed 100 m.
Most hand-held instruments give reasonable positional fixes using three
satellites but need four to even attempt an elevation. This is because the
unknown quantities at each fix include the value of the offset between
the instrument’s internal clock and the synchronized clocks of the satellite


constellation. Four unknowns require four measurements. Unfortunately, in
some cases the information as to whether ‘3D navigation’ is being achieved
is not included on the display that shows the co-ordinates (e.g. Figure 1.15),
and the only indication that the fourth satellite has been ‘lost’ may be a
suspicious lack of variation in the elevation reading.

Geophysical Data

Some geophysical readings are of true point data but others are obtained
using sources that are separated from detectors. Where values are determined
between rather than at points, readings will be affected by orientation. Precise
field notes are always important but especially so in these cases, since reading
points must be defined and orientations must be recorded.

If transmitters, receivers and/or electrodes are laid out in straight lines
and the whole system can be reversed without changing the reading, the midpoint
should be considered the reading point. Special notations are needed
for asymmetric systems, and the increased probability of positioning error is
in itself a reason for avoiding asymmetry. Especial care must be taken when
recording the positions of sources and detectors in seismic work.

 Station numbering
Station numbering should be logical and consistent. Where data are collected
along traverses, numbers should define positions in relation to the traverse
grid. Infilling between traverse stations 3 and 4 with stations 3.25  , 3.5 and 3.75
is clumsy and may create typing problems, whereas defining as 325E a
station halfway between stations 300E and 350E, which are 50 metres apart,
is easy and unambiguous. The fashion for labelling such a station 300+25E
has no discernible advantages and uses a plus sign which may be needed,
with digital field systems or in subsequent processing, to stand for N or E. It
may be worth defining the grid origin in such a way that S or W stations do
not occur, and this may be essential with data loggers that cannot cope with
either negatives or points of the compass.
Stations scattered randomly through an area are best numbered sequentially.
Positions can be recorded in the field by pricking through maps or
air-photos and labelling the reverse sides. Estimating coordinates in the field
from maps may seem desirable but mistakes are easily made and valuable
time is lost. Station coordinates are now often obtained from GPS receivers
(Section 1.5), but differential GPS may be needed to provide sufficient accuracy
for detailed surveys.
If several observers are involved in a single survey, numbers can easily
be accidentally duplicated. All field books and sheets should record the name
of the observer. The interpreter or data processor will need to know who to
look for when things go wrong.
Recording results
Geophysical results are primarily numerical and must be recorded even more
carefully than qualitative observations of field geology. Words, although
sometimes difficult to read, can usually be deciphered eventually, but a set of
numbers may be wholly illegible or, even worse, may be misread. The need
for extra care has to be reconciled with the fact that geophysical observers are
usually in more of a hurry than are geologists, since their work may involve
instruments that are subject to drift, draw power from batteries at frightening
speed or are on hire at high daily rates.
Numbers may, of course, not only be misread but miswritten. The circumstances
under which data are recorded in the field are varied but seldom

ideal. Observers are usually either too hot, too cold, too wet or too thirsty.
Under such conditions, they may delete correct results and replace them with
incorrect ones, in moments of confusion or temporary dyslexia. Data on geophysical
field sheets should therefore never be erased. Corrections should
be made by crossing out the incorrect items, preserving their legibility, and
writing the correct values alongside. Something may then be salvaged even
if the correction is wrong. Precise reporting standards must be enforced and
strict routines must be followed if errors are to be minimized. Reading the
instrument twice at each occupation of a station, and recording both values,
reduces the incidence of major errors.
Loss of geophysical data tends to be final. Some of the qualitative observations
in a geological notebook might be remembered and re-recorded, but
not strings of numbers. Copies are therefore essential and should be made
in the field, using duplicating sheets or carbon paper, or by transcribing the
results each evening. Whichever method is used, originals and duplicates
must be separated immediately and stored separately thereafter. Duplication
is useless if copies are stored, and lost, together. This, of course, applies
equally to data stored in a data logger incorporated in, or linked to, the field
instrument. Such data should be checked, and backed up, each evening.
Digital data loggers are usually poorly adapted to storing non-numeric
information, but observers are uniquely placed to note and comment on a
multitude of topographic, geological, manmade (cultural ) and climatic factors
that may affect the geophysical results. If they fail to do so, the data that
they have gathered may be interpreted incorrectly. If data loggers are not
being used, comments should normally be recorded in notebooks, alongside
the readings concerned. If they are being used, adequate supplementary positional
data must be stored elsewhere. In archaeological and site investigation
surveys, where large numbers of readings are taken in very small areas, annotated
sketches are always useful and may be essential. Sketch maps should
be made wherever the distances of survey points or lines from features in
the environment are important. Geophysical field workers may also have a
responsibility to pass on to their geological colleagues information of interest
about places that only they may visit. They should at least be willing to
record dips and strikes, and perhaps to return with rock samples where these
would be useful.
Accuracy, sensitivity, precision
Accuracy must be distinguished from sensitivity. A standard gravity meter,
for example, is sensitive to field changes of one-tenth of a gravity unit
but an equivalent level of accuracy will be achieved only if readings are
carefully made and drift and tidal corrections are correctly applied. Accuracy
is thus limited, but not determined, by instrument sensitivity. Precision,


which is concerned only with the numerical presentation of results (e.g. the
number of decimal places used), should always be appropriate to accuracy
(Example 1.1). Not only does superfluous precision waste time but false conclusions
may be drawn from the high implied accuracy.


Example 1.1
Gravity reading = 858.3 scale units
Calibration constant = 1.0245 g.u. per scale division (see Section 2.1)
Converted reading = 879.32835 g.u.
But reading accuracy is only 0.1 g.u. (approximately), and therefore:
Converted reading = 879.3 g.u.
(Four decimal place precision is needed in the calibration constant, because
858.3 multiplied by 0.0001 is equal to almost 0.1 g.u.)


Geophysical measurements can sometimes be made to a greater accuracy
than is needed, or even usable, by the interpreters. However, the highest
possible accuracy should always be sought, as later advances may allow the
data to be analysed more effectively.
 Drift
A geophysical instrument will usually not record the same results if read
repeatedly at the same place. This may be due to changes in background
field but can also be caused by changes in the instrument itself, i.e. to drift.
Drift correction is often the essential first stage in data analysis, and is usually
based on repeat readings at base stations (Section 1.4).
Instrument drift is often related to temperature and is unlikely to be linear
between two readings taken in the relative cool at the beginning and end of
a day if temperatures are 10 or 20 degrees higher at noon. Survey loops may
therefore have to be limited to periods of only one or two hours.
Drift calculations should be made whilst the field crew is still in the
survey area so that readings may be repeated if the drift-corrected results
appear questionable. Changes in background field are sometimes treated as
drift but in most cases the variations can either be monitored directly (as in
magnetics) or calculated (as in gravity). Where such alternatives exist, it is
preferable they be used, since poor instrument performance may otherwise
be overlooked.
 Signal and noise
To a geophysicist, signal is the object of the survey and noise is anything
else that is measured but is considered to contain no useful information. One
observer’s signal may be another’s noise. The magnetic effect of a buried


normal distribution lie within 1 SD of the mean, and less than 0.3% differ
from it by more than 3 SDs. The SD is popular with contractors when quoting
survey reliability, since a small value can efficiently conceal several major
errors. Geophysical surveys rarely provide enough field data for statistical
methods to be validly applied, and distributions are more often assumed to
be normal than proven to be so.
 Anomalies
Only rarely is a single geophysical observation significant. Usually, many
readings are needed, and regional background levels must be determined,
before interpretation can begin. Interpreters tend to concentrate on anomalies,
i.e. on differences from a constant or smoothly varying background.
Geophysical anomalies take many forms. A massive sulphide deposit containing
pyrrhotite would be dense, magnetic and electrically conductive. Typical
anomaly profiles recorded over such a body by various types of geophysical
survey are shown in Figure 1.8. A wide variety of possible contour patterns
correspond to these differently shaped profiles.
Background fields also vary and may, at different scales, be regarded as
anomalous. A ‘mineralization’ gravity anomaly, for example, might lie on
a broader high due to a mass of basic rock. Separation of regionals from
residuals is an important part of geophysical data processing and even in the
field it may be necessary to estimate background so that the significance of
local anomalies can be assessed. On profiles, background fields estimated by
eye may be more reliable than those obtained using a computer, because of
the virtual impossibility of writing a computer program that will produce a
background field uninfluenced by the anomalous values (Figure 1.9). Computer
methods are, however, essential when deriving backgrounds from data
gathered over an area rather than along a single line.
The existence of an anomaly indicates a difference between the real world
and some simple model, and in gravity work the terms free air, Bouguer
and isostatic anomaly are commonly used to denote derived quantities that
represent differences from gross Earth models. These so-called anomalies
are sometimes almost constant within a small survey area, i.e. the area is
not anomalous! Use of terms such as Bouguer gravity (rather than Bouguer
anomaly) avoids this confusion.
 Wavelengths and half-widths
Geophysical anomalies in profile often resemble transient waves but vary
in space rather than time. In describing them the terms frequency and frequency
content are often loosely used, although wavenumber (the number of
complete waves in unit distance) is pedantically correct. Wavelength may be
quite properly used of a spatially varying quantity, but is imprecise where


geophysical anomalies are concerned because an anomaly described as having
a single ‘wavelength’ would be resolved by Fourier analysis into a number
of components of different wavelengths.
A more easily estimated quantity is the half-width, which is equal to half
the distance between the points at which the amplitude has fallen to half the
anomaly maximum (cf. Figure 1.8a). This is roughly equal to a quarter of
the wavelength of the dominant sinusoidal component, but has the advantage
of being directly measurable on field data. Wavelengths and half-widths are
important because they are related to the depths of sources. Other things
being equal, the deeper the source, the broader the anomaly.
 Presentation of results
The results of surveys along traverse lines can be presented in profile form,
as in Figure 1.8. It is usually possible to plot profiles in the field, or at
least each evening, as work progresses, and such plots are vital for quality
control. A laptop computer can reduce the work involved, and many modern
instruments and data loggers are programmed to display profiles in ‘real time’
as work proceeds.
A traverse line drawn on a topographic map can be used as the baseline
for a geophysical profile. This type of presentation is particularly helpful
in identifying anomalies due to manmade features, since correlations with
features such as roads and field boundaries are obvious. If profiles along a
number of different traverses are plotted in this way on a single map they are

said to be stacked, a word otherwise used for the addition of multiple data
sets to form a single output set (see Section 1.3.5).
Contour maps used to be drawn in the field only if the strike of some
feature had to be defined quickly so that infill work could be planned, but
once again the routine use of laptop computers has vastly reduced the work
involved. However, information is lost in contouring because it is not generally
possible to choose a contour interval that faithfully records all the features
of the original data. Also, contour lines are drawn in the areas between traverses,
where there are no data, and inevitably introduce a form of noise.
Examination of contour patterns is not, therefore, the complete answer to
field quality control.
Cross-sectional contour maps (pseudo-sections) are described in
Sections 6.3.5 and 7.4.2.
In engineering site surveys, pollution monitoring and archaeology, the
objects of interest are generally close to the surface and their positions in
plan are usually much more important than their depths. They are, moreover,
likely to be small and to produce anomalies detectable only over very small
areas. Data have therefore to be collected on very closely spaced grids and can
often be presented most effectively if background-adjusted values are used
to determine the colour or grey-scale shades of picture elements (pixels) that
can be manipulated by image-processing techniques. Interpretation then relies
on pattern recognition and a single pixel value is seldom important. Noise
is eliminated by eye, i.e. patterns such as those in Figure 1.10 are easily
recognized as due to human activity.


 Data loggers
During the past decade, automation of geophysical equipment in small-scale
surveys has progressed from a rarity to a fact of life. Although many of the
older types of instrument are still in use, and giving valuable service, they now
compete with variants containing the sort of computer power employed, 30
years ago, to put a man on the moon. At least one manufacturer now proudly
boasts ‘no notebook’, even though the instrument in question is equipped
with only a numerical key pad so that there is no possibility of entering
text comments into the (more than ample) memory. On other automated
instruments the data display is so small and so poorly positioned that the
possibility that the observer might actually want to look at, and even think
about, his observations as he collects them has clearly not been considered.
Unfortunately, this pessimism may all too often be justified, partly because of
the speed with which readings, even when in principle discontinuous, can now
be taken and logged. Quality control thus often depends on the subsequent
playback and display of whole sets of data, and it is absolutely essential that
this is done on, at the most, a daily basis. As Oscar Wilde might have said
(had he opted for a career in field geophysics), to spend a few hours recording
rubbish might be accounted a misfortune. To spend anything more than a day
doing so looks suspiciously like carelessness.
Automatic data loggers, whether ‘built-in’ or separate, are particularly
useful where instruments can be dragged, pushed or carried along traverse
to provide virtually continuous readings. Often, all that is required of the
operators is that they press a key to initiate the reading process, walk along
the traverse at constant speed and press the key again when the traverse is
completed. On lines more than about 20 m long, additional keystrokes can
be used to ‘mark’ intermediate survey points.
One consequence of continuous recording has been the appearance in
ground surveys of errors of types once common in airborne surveys which
have now been almost eliminated by improved compensation methods and
GPS navigation. These were broadly divided into parallax errors, heading
errors, ground clearance/coupling errors and errors due to speed variations.
With the system shown in Figure 1.11, parallax errors can occur because
the magnetic sensor is about a metre ahead of the GPS sensor. Similar errors
can occur in surveys where positions are recorded by key strokes on a data
logger. If the key is depressed by the operator when he, rather than the sensor,
passes a survey peg, all readings will be displaced from their true positions.
If, as is normal practice, alternate lines on the grid are traversed in opposite
directions, a herringbone pattern will be imposed on a linear anomaly, with
the position of the peak fluctuating backwards and forwards according to the
direction in which the operator was walking (Figure 1.12a).


False anomalies can also be produced in airborne surveys if ground
clearance is allowed to vary, and similar effects can now be observed in
ground surveys. Keeping the sensor shown in Figure 1.11 at a constant height
above the ground is not easy (although a light flexible ‘spacer’ hanging from
it can help). On level ground there tends to be a rhythmic effect associated
with the operator’s motion, and this can sometimes appear on contour maps
as ‘striping’ at right angles to the traverse when minor peaks and troughs on
adjacent lines are linked to each other by the contouring algorithm. On slopes
there will, inevitably, be a tendency for a sensor in front of the observer to
be closer to the ground when going uphill than when going down. How
this will affect the final maps will vary with the nature of the terrain, but
in an area with constant slope there will a tendency for background levels
to be different on parallel lines traversed in opposite directions. This can
produce herringbone effects on individual contour lines in low gradient areas
(Figure 1.12b).
Heading errors occurred in airborne (especially aeromagnetic) surveys
because the effect of the aircraft on the sensor depended on aircraft orientation.


A similar effect can occur in a ground magnetic survey if the observer is
carrying any iron or steel material. The induced magnetization in these objects
will vary according to the facing direction, producing effects similar to those
produced by constant slopes, i.e. similar to those in Figure 1.12b.
Before the introduction of GPS navigation, flight path recovery in airborne
surveys relied on interpolation between points identified photographically.
Necessarily, ground speed was assumed constant between these points, and
anomalies were displaced if this was not the case. Similar effects can now be
seen in datalogged ground surveys. Particularly common reasons for slight
displacements of anomalies are that the observer either presses the key to start
recording at the start of the traverse, and then starts walking or, at the end of
the traverse, stops walking and only then presses the key to stop recording.
These effects can be avoided by insisting that observers begin walking before
the start of the traverse and continue walking until the end point has been

safely passed. If, however, speed changes are due to rugged ground, all that
can be done is to increase the number of ‘marked’ points.
Many data loggers not only record data but have screens large enough
to show individual and multiple profiles, allowing a considerable degree of
quality control in the field. Further quality control will normally be done each
evening, using automatic contouring programs on laptop PCs, but allowance
must be made for the fact that automatic contouring programs tend to introduce
their own distortions (Figure 1.12c).

Geophysical Fieldwork

Geophysical instruments vary widely in size and complexity but all are used
to make physical measurements, of the sort commonly made in laboratories, at
temporary sites in sometimes hostile conditions. They should be economical
in power use, portable, rugged, reliable and simple. These criteria are satisfied
to varying extents by the commercial equipment currently available.
 Choosing geophysical instruments
Few instrument designers can have tried using their own products for long
periods in the field, since operator comfort seldom seems to have been
considered. Moreover, although many real improvements have been made
in the last 30 years, design features have been introduced during the same
period, for no obvious reasons, that have actually made fieldwork more difficult.
The proton magnetometer staff, discussed below, is a case in point.
If different instruments can, in principle, do the same job to the same
standards, practical considerations become paramount. Some of these are
listed below.
Serviceability: Is the manual comprehensive and comprehensible? Is a
breakdown likely to be repairable in the field? Are there facilities for repairing
major failures in the country of use or would the instrument have to be sent
overseas, risking long delays en route and in customs? Reliability is vital but
some manufacturers seem to use their customers to evaluate prototypes.
Power supplies: If dry batteries are used, are they of types easy to replace
or will they be impossible to find outside major cities? If rechargeable batteries
are used, how heavy are they? In either case, how long will the batteries
last at the temperatures expected in the field? Note that battery life is reduced
in cold climates. The reduction can be dramatic if one of the functions of the
battery is to keep the instrument at a constant temperature.
Data displays: Are these clearly legible under all circumstances? A torch
is needed to read some in poor light and others are almost invisible in
bright sunlight. Large displays used to show continuous traces or profiles
can exhaust power supplies very quickly.
Hard copy: If hard copy records can be produced directly from the field
instrument, are they of adequate quality? Are they truly permanent, or will
they become illegible if they get wet, are abraded or are exposed to sunlight?
Comfort: Is prolonged use likely to cripple the operator? Some instruments
are designed to be suspended on a strap passing across the back of
the neck. This is tiring under any circumstances and can cause serious medical
problems if the instrument has to be levelled by bracing it against the
strap. Passing the strap over one shoulder and under the other arm may
reduce the strain but not all instruments are easy to use when carried in
this way.
Convenience: If the instrument is placed on the ground, will it stand
upright? Is the cable then long enough to reach the sensor in its normal
operating position? If the sensor is mounted on a tripod or pole, is this strong
enough? The traditional proton magnetometer poles, in sections that screwed
together and ended in spikes that could be stuck into soft ground, have now
been largely replaced by unspiked hinged rods that are more awkward to
stow away, much more fragile (the hinges can twist and break), can only be
used if fully extended and must be supported at all times.
Fieldworthiness: Are the control knobs and connectors protected from
accidental impact? Is the casing truly waterproof? Does protection from damp
grass depend on the instrument being set down in a certain way? Are there
depressions on the console where moisture will collect and then inevitably
seep inside?
Automation: Computer control has been introduced into almost all the
instruments in current production (although older, less sophisticated models
are still in common use). Switches have almost vanished, and every instruction
has to be entered via a keypad. This has reduced the problems that
used to be caused by electrical spikes generated by switches but, because the
settings are often not permanently visible, unsuitable values may be repeatedly
used in error. Moreover, simple operations have sometimes been made
unduly complicated by the need to access nested menus. Some instruments
do not allow readings to be taken until line and station numbers have been
entered and some even demand to know the distance to the next station and
to the next line!
The computer revolution has produced real advances in field geophysics,
but it has its drawbacks. Most notably, the ability to store data digitally in
data loggers has discouraged the making of notes on field conditions where
these, however important, do not fall within the restricted range of options
the logger provides. This problem is further discussed in Section 1.3.2. 
 Cables
Almost all geophysical work involves cables, which may be short, linking
instruments to sensors or batteries, or hundreds of metres long. Electrical
induction between cables (electromagnetic coupling, also known as crosstalk
) can be a serious source of noise (see also Section 11.3.5).
Efficiency in cable handling is an absolute necessity. Long cables always
tend to become tangled, often because of well-intentioned attempts to make
neat coils using hand and elbow. Figures of eight are better than simple loops,
but even so it takes an expert to construct a coil from which cable can be
run freely once it has been removed from the arm. On the other hand, a
seemingly chaotic pile of wire spread loosely on the ground can be quite
trouble-free. The basic rule is that cable must be fed on and off the pile in
opposite directions, i.e. the last bit of cable fed on must be the first to be
pulled off. Any attempts to pull cable from the bottom will almost certainly
end in disaster.
Cable piles are also unlikely to cause the permanent kinks which are often
features of neat and tidy coils and which may have to be removed by allowing
the cable to hang freely and untwist naturally. Places where this is possible
with 100-metre lengths are rare.
Piles can be made portable by feeding cables into open boxes, and on
many seismic surveys the shot-firers carried their firing lines in this way in
old gelignite boxes. Ideally, however, if cables are to be carried from place
to place, they should be wound on properly designed drums. Even then,
problems can occur. If cable is unwound by pulling on its free end, the drum
will not stop simply because the pull stops, and a free-running drum is an
effective, but untidy, knitting machine.
A drum carried as a back-pack should have an efficient brake and should
be reversible so that it can be carried across the chest and be wound from
a standing position. Some drums sold with geophysical instruments combine
total impracticality with inordinate expense and are inferior to home-made or
garden-centre versions.
Geophysical lines exert an almost hypnotic influence on livestock. Cattle
have been known to desert lush pastures in favour of midnight treks through
hedges and across ditches in search of juicy cables. Not only can a survey be
delayed but a valuable animal may be killed by biting into a live conductor,
and constant vigilance is essential.
 Connections
Crocodile clips are usually adequate for electrical connections between single
conductors. Heavy plugs must be used for multi-conductor connections and
are usually the weakest links in the entire field system. They should be
placed on the ground very gently and as seldom as possible and, if they do
not have screw-on caps, be protected with plastic bags or ‘clingfilm’. They
must be shielded from grit as well as moisture. Faults are often caused by dirt
increasing wear on the contacts in socket units, which are almost impossible
to clean.
Plugs should be clamped to their cables, since any strain will otherwise
be borne by the weak soldered connections to the individual pins. Inevitably,
the cables are flexed repeatedly just beyond the clamps, and wires may break
within the insulated sleeving at these points. Any break there, or a broken or
dry joint inside the plug, means work with a soldering iron. This is never easy
when connector pins are clotted with old solder, and is especially difficult if
many wires crowd into a single plug.
Problems with plugs can be minimized by ensuring that, when moving,
they are always carried, never dragged along the ground. Two hands should
always be used, one holding the cable to take the strain of any sudden pull,
the other to support the plug itself. The rate at which cable is reeled in should
never exceed a comfortable walking pace, and especial care is needed when
the last few metres are being wound on to a drum. Drums should be fitted
with clips or sockets where the plugs can be secured when not in use.
 Geophysics in the rain
A geophysicist, huddled over his instruments, is a sitting target for rain, hail,
snow and dust, as well as mosquitoes, snakes and dogs. His most useful piece

of field clothing is often a large waterproof cape which he can not only wrap
around himself but into which he can retreat, along with his instruments, to
continue work .
Electrical methods that rely on direct or close contact with the ground
generally do not work in the rain, and heavy rain can be a source of seismic
noise. Other types of survey can continue, since most geophysical instruments
are supposed to be waterproof and some actually are. However, unless
dry weather can be guaranteed, a field party should be plentifully supplied
with plastic bags and sheeting to protect instruments, and paper towels for
drying them. Large transparent plastic bags can often be used to enclose
instruments completely while they are being used, but even then condensation
may create new conductive paths, leading to drift and erratic behaviour.
Silica gel within instruments can absorb minor traces of moisture but cannot
cope with large amounts, and a portable hair-drier held at the base camp may
be invaluable.
 A geophysical toolkit
Regardless of the specific type of geophysical survey, similar tools are likely
to be needed. A field toolkit should include the following:
• Long-nose pliers (the longer and thinner the better)
• Slot-head screwdrivers (one very fine, one normal)
• Phillips screwdriver
• Allen keys (metric and imperial)
• Scalpels (light, expendable types are best)
• Wire cutters/strippers
• Electrical contact cleaner (spray)
• Fine-point 12V soldering iron
• Solder and ‘Solder-sucker’
• Multimeter (mainly for continuity and battery checks, so small size and
durability are more important than high sensitivity)
• Torch (preferably of a type that will stand unsupported and double as a
table lamp. A ‘head torch’ can be very useful)
• Hand lens
• Insulating tape, preferably self-amalgamating
• Strong epoxy glue/‘super-glue’
• Silicone grease
• Waterproof sealing compound
• Spare insulated and bare wire, and connectors
• Spare insulating sleeving
• Kitchen cloths and paper towels
• Plastic bags and ‘clingfilm’
A comprehensive first-aid kit is equally vital.

Fields

Although there are many different geophysical methods, small-scale surveys
all tend to be rather alike and involve similar, and sometimes ambiguous,
jargon. For example, the word base has three different common meanings,
and stacked and field have two each.
Measurements in geophysical surveys are made in the field but, unfortunately,
many are also of fields. Field theory is fundamental to gravity,
magnetic and electromagnetic work, and even particle fluxes and seismic
wavefronts can be described in terms of radiation fields. Sometimes ambiguity
is unimportant, and sometimes both meanings are appropriate (and
intended), but there are occasions when it is necessary to make clear distinctions.
In particular, the term field reading is almost always used to identify
readings made in the field, i.e. not at a base station.
The fields used in geophysical surveys may be natural ones (e.g. the
Earth’s magnetic or gravity fields) but may be created artificially, as when
alternating currents are used to generate electromagnetic fields. This leads to
the broad classification of geophysical methods into passive and active types,
respectively.
Physical fields can be illustrated by lines of force that show the field
direction at any point. Intensity can also be indicated, by using more closely
spaced lines for strong fields, but it is difficult to do this quantitatively where
three-dimensional situations are being illustrated on two-dimensional media.
 Vector addition
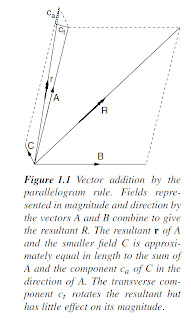
Vector addition (Figure 1.1) must be used when combining fields from different
sources. In passive methods, knowledge of the principles of vector
addition is needed to understand the ways in which measurements of local
anomalies are affected by regional backgrounds. In active methods, a local
anomaly (secondary field) is often superimposed on a primary field produced
by a transmitter. In either case, if the local field is much the weaker of the two
(in practice, less than one-tenth the strength of the primary or background
field), then the measurement will, to a first approximation, be made in the
direction of the stronger field and only the component in this direction of
the secondary field (ca in Figure 1.1) will be measured. In most surveys the
slight difference in direction between the resultant and the background or
primary field can be ignored.

If the two fields are similar in
strength, there will be no simple
relationship between the magnitude
of the anomalous field and the
magnitude of the observed anomaly.
However, variations in any given
component of the secondary field
can be estimated by taking all
measurements in an appropriate
direction and assuming that the
component of the background or
primary field in this direction is
constant over the survey area.
Measurements of vertical rather than
total fields are sometimes preferred
in magnetic and electromagnetic
surveys for this reason.
The fields due to multiple sources
are not necessarily equal to the
vector sums of the fields that would
have existed had those sources
been present in isolation. A strong
magnetic field from one body can
affect the magnetization in another,
or even in itself (demagnetization
effect), and the interactions between fields and currents in electrical and
electromagnetic surveys can be very complex.
 The inverse-square law
Inverse-square law attenuation of signal strength occurs in most branches of
applied geophysics. It is at its simplest in gravity work, where the field due
to a point mass is inversely proportional to the square of the distance from
the mass, and the constant of proportionality (the gravitational constant G)
is invariant. Magnetic fields also obey an inverse-square law. The fact that
their strength is, in principle, modified by the permeability of the medium
is irrelevant in most geophysical work, where measurements are made in
either air or water. Magnetic sources are, however, essentially bipolar, and
the modifications to the simple inverse-square law due to this fact are much
more important (Section 1.1.5).
Electric current flowing from an isolated point electrode embedded in
a continuous homogeneous ground provides a physical illustration of the


significance of the inverse-square law. All of the current leaving the electrode
must cross any closed surface that surrounds it. If this surface is a sphere
concentric with the electrode, the same fraction of the total current will cross
each unit area on the surface of the sphere. The current per unit area will
therefore be inversely proportional to the total surface area, which is in turn
proportional to the square of the radius. Current flow in the real Earth is, of
course, drastically modified by conductivity variations.
1.1.3 Two-dimensional sources
Rates of decrease in field strengths depend on source shapes as well as on
the inverse-square law. Infinitely long sources of constant cross-section are
termed two-dimensional (2D) and are often used in computer modelling to
approximate bodies of large strike extent. If the source ‘point’ in Figure 1.2
represents an infinite line source seen end on, the area of the enclosing (cylindrical)
surface is proportional to the radius. The argument applied in the
previous section to a point source implies that in this case the field strength
is inversely proportional to distance and not to its square. In 2D situations,
lines of force drawn on pieces of paper illustrate field magnitude (by their
separation) as well as direction.


The lines of force or radiation intensity from a source consisting of a homogeneous layer of
constant thickness diverge only near its edges (Figure 1.3). The Bouguer plate of gravity reductions (Section 2.5.1) and the radioactive source with 2π geometry (Section 4.3.3) are examples of infinitely extended layer sources, for which field strengths are independent
of distance. This condition is approximately achieved if a detector is only a short distance
above an extended source and a long way from its edges.

A dipole consists of equal-strength positive and negative point sources a very small distance apart. Field strength decreases as the inverse cube of distance and both strength and direction change with ‘latitude’ (Figure 1.4). The intensity of the field at a point on a dipole
axis is double the intensity at a point the same distance away on the dipole ‘equator’, and in the opposite direction.


Electrodes are used in some
electrical surveys in approximately
dipolar pairs and magnetization is
fundamentally dipolar. Electric currents
circulating in small loops are
dipolar sources of magnetic field.


Exponential decay
Radioactive particle fluxes and seismic and electromagnetic waves are subject
to absorption as well as geometrical attenuation, and the energy crossing


closed surfaces is then less than the energy emitted by the sources they
enclose. In homogeneous media, the percentage loss of signal is determined
by the path length and the attenuation constant. The absolute loss is proportional
also to the signal strength. A similar exponential law (Figure 1.5),
governed by a decay constant, determines the rate of loss of mass by a
radioactive substance.
Attenuation rates are alternatively characterized by skin depths, which
are the reciprocals of attenuation constants. For each skin depth travelled, the
signal strength decreases to 1/e of its original value, where e (= 2.718) is the
base of natural logarithms. Radioactivity decay rates are normally described in
terms of the half-lives, equal to loge2 (= 0.693) divided by the decay constant.
During each half-life period, one half of the material present at its start is lost.