On the basis of this study, the following conclusions can be drawn:
- The multi-scale nested grids approach can be proposed as a solution in many cases
but is willing to distribute degraded data (in coarser resolution). The aggregation
methodology can be considered a valuable one which contributes to the
degradation (without losing the real values) of very detailed data and may allow
the scientific community to access valuable information without having any
copyright problems.
- For a number of reasons upscaling can be useful in soil science domain: respect of
databases in various scales and simplification of thematic maps.
- Upscaling methodology has proven to be good enough for identification of “data
before a possible aggregation for reporting reasons.
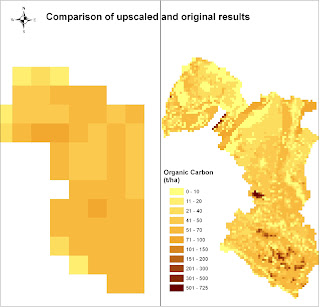
- Upscaling has a serious drawback in case the source dataset in the finer scale has high
10km2. The descriptive statistics show the smooth effect that upscaling may cause in
high variability cases. Upscaling involves recognition of general pattern in data
distribution and this can be considered an advantage for environmental indicators. In
any case the upscaled output doesn’t represent the real world but it is a smooth
approximation. The upscaling from local scale to upper scales involves trade-offs and
compromises.
- Despite the limitations, the scale transfer method presented here was well-suited to
giving appropriate responses to policy makers. Moreover, a series of newly
introduced concepts/indicators such as “Non-Perfect Square” Coverage, Correlation
Coefficient for predictions and Lost of Variation can be introduced for further
research and evaluation.
- Digital Soil Mapping (DSM) offers new opportunities for the prediction of
