Primary Energy Consumption and CO2 Emissions
- Development of Primary Energy Consumption in the Past 40 Years
the past 40 years. Figure 1.1 presents the development of primary energy consumption,
broken down into groupings, namely industrial countries of the OECD; former
Soviet Union; and emerging economies (i.e. developing countries). In 1965, the
worldwide consumption of primary energy amounted to only 3,860 MTOE (million
tonnes of oil equivalent); by 2005, it had increased to 10,224 MTOE. This corresponds
to an increase of 172% or an annual rate of increase of 2.5% (BP 2008). In
industrial countries, the increase was around 107% for 40 years, corresponding to
an annual rate of increase of almost 2%. In the emerging economies, which started
from a lower absolute level, the increase was 640%, which corresponds to an annual
rate of increase of more than 5%.
Figure 1.2 shows the share of primary energy consumption of the different countries
and regions for the year 2005. A conspicuous fact here is the high share of
North America, where in the USA alone almost a quarter of the entire primary
energy of the world is consumed.
In 2005, the fossil energy sources, i.e. crude oil, natural gas and coal, comprised
87% of primary energy consumption (see Fig. 1.3).
- Developments Until 2030
assumptions about the total population, the gross national product and the energy
efficiency of different countries and are highly dependent on general political conditions.
The following shall present predictions of the development of the energy
demand up until 2030, which predominantly rely on an extrapolation of the current
developments and general conditions. The effect of political measures introduced

until now is reflected; future possible and also probable measures are not taken into
consideration. The reference scenario of the International Energy Agency (IEA) in
2006, for instance, assumes a growth of the world population to 8.1 thousand million
up to the year 2030 (2004: 6.4 thousand million), an increase of the gross national
product of 4% at the beginning, levelling off at 2.9% per year, and natural oil prices
of somewhat more than $60 per barrel (real price 2005). Technologies of power
supply and energy utilisation (end-use technologies) become ever more efficient.
The predictions illustrated in Figs. 1.4, 1.5, 1.6 and 1.7 of global primary energy
demand, electric power generation, installed power plant capacities and CO2 emissions
rely on data of the IEA and the US Department of Energy (DoE) (IEA 2002,


2006b, a; DoE 2007). They describe probable development if no dramatic measures
are taken to reduce energy consumption and CO2 emissions. Possible measures shall
be discussed in Sect. 1.3.
According to Fig. 1.4, global primary energy consumption will increase by more
than 60% (in comparison to the year 2000) by 2030, which corresponds to an annual
rate of increase of about 1.6%. This increase can be explained on the one hand
by the growth of the world population and on the other by the accumulated needs
of the emerging economies, such as China and India. Predictions, for example for
China, say that the energy consumption will double in such countries. Fossil energy
sources will continue to cover more than 80% of the primary energy consumption in
2030, with crude oil still making up the most important energy source, with a rough
fraction of about 35%. Natural gas among all the energy sources shows the highest
rates of increase – the consumption of it will double with respect to the year 2000
and its relative fraction will rise to 26%. The fraction of coal will decrease slightly,
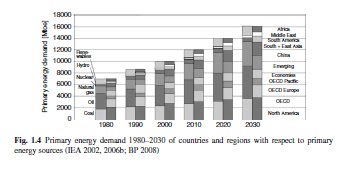

50% from the year 2000.
Electric power (see Fig. 1.5) will still further consolidate its great importance
as an end-use energy source. The consumption of electric power will about double
between 2000 and 2030, the rates of increase of 2.4% per year ranging clearly above
the growth rates of primary energy consumption. Coal, with about 37%, will be the
most important primary energy source in electric power generation; natural gas will
increase its share to more than 30%.
The predicted rise of electric power consumption requires the installation of
new power plants on a considerable scale (see Fig. 1.6). The power plant capacity
installed worldwide amounted to about 3,400GW in 2000 and is supposed to
rise to 7,060 in 2030. Taking into consideration that old plants have to be removed
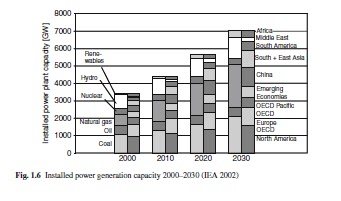

with a total capacity of 4,800GW will have to be erected throughout the world.
This corresponds to 9,600 power plants with an electrical power output of 500MW.
One has to assume in this respect that new power plants will be built predominantly
for primary energy sources such as natural gas (about 2,000 GW) and coal (about
1,500 GW). In China alone, thermal power plants, for example, with a total power
of 720GW shall have to be installed by 2020; per year, between 30 and 40 new
coal-fired power plants with a capacity of 600MW are currently being built. While
in the emerging economies and developing countries, new power plants cover the
added demand, new power plants in Europe are planned mainly as substitutes for
existing old plants. By the year 2020, about 200GW of power station capacity shall
be newly installed in Europe.
The CO2 emissions illustrated in Fig. 1.7 suggest a likely rise to about 38 thousand
million tonnes of carbon dioxide per year until 2030. Referring to the year
2000, this corresponds to a rise of about 68%.
to be continued